We’re just going to say it: Video ads can be disruptive. You know it, we know it, and the consumers have made it VERY clear they know it.
If the viewer already knows the brand, then the average ad is just a barrier to ignore on their way to the content they want, making the experience not worth their time. But KERV’s interactive, shoppable videos present consumers the choice to engage more through mid-funnel tactics. Is that enough to make them leap?
We’ve got data that says it does.
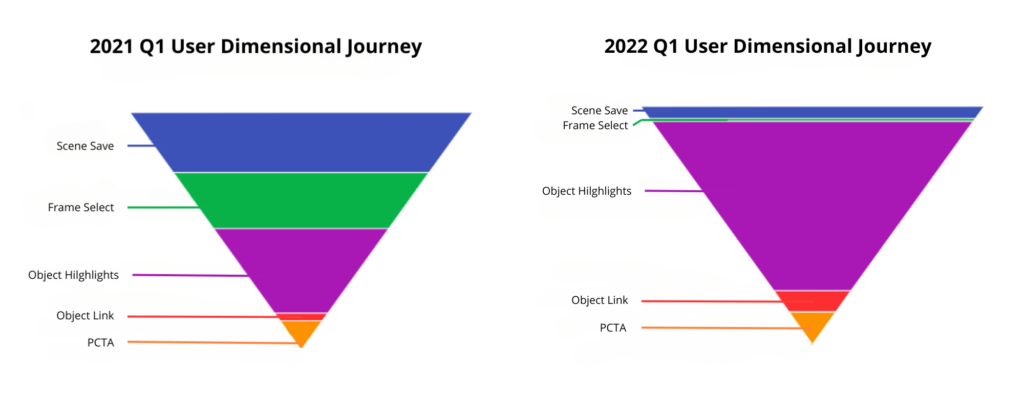
The Dimensional User Journey shows a full-funnel experience
In our last blog, we talked about interactive, shoppable video’s explosive first few years on the scene, and how KERV’s 20+ proprietary metrics can build a two-way conversation between brands and consumers.
You can check out that blog here. But for a quick recap, while overall impressions accumulated by KERV-powered video increased by over 1200% since 2021 the click rates rose as well, by over 56%, a clear sign that consumers are leaning into this new format.
But after a more in-depth review, we’ve discovered a deeper impact interactive, shoppable videos have on consumer behavior. We’ve applied this data to our own funnel design and created a Dimensional User Journey. It maps 6 crucial metrics to the traditional marketing funnel. These metrics include:
- Scene Save (SSV): Clicks within the video player to initiate exploration
- Frame Select (FrmSel): Clicks within the save scenes, including left/right arrows.
- Object Highlight (OH): Amount of seconds spent hovered over an object to explore KERV’s pixel-edge glow display.
- Object Link (OL): Clicks on the objects. This click requires a series of interactions prior.
- Primary CTA Click (PCTA): Clicks on the primary CTA button
- Brand Logo Click (BLC): Clicks on the brand logo

Video ads have always provided upper-funnel success—and the ability to pause and interact with them only improves that—but what’s really exciting is the choice they present to the consumer: Get on with the content their waiting for or take a detour down the funnel to research and consider the product on their own accord.
The choice seems obvious right? That precious content of theirs is waiting after all. Well, don’t be so sure…
Consumers WANT to know more about your product
If your favorite color is purple, then you probably love the journey chart above. This is the Object Highlight metric—the time a user spends hovering over an in-video product (like a necklace, face cream, or bag of dog food), for at least a half-second, to find out more about it (material, calorie count, or price).
Consumers are not required to spend time within the video ad, and yet they’re choosing to. When given the opportunity to engage within a quality UX, the consumer will follow. Create an immersive experience, and they’ll create their own journey. The metrics over time show promising growth:
- Scene Saves have increased by over 200% since 2021 Q1
- Object Highlights and Object Links (lower funnel metrics) have increased nearly 3,000% since 2021 Q1 🤯
But the strategy doesn’t have to end there. Data points like Object Highlights can be categorized and used for sequential targeting that further push consumers down the funnel, in a strategic way, while driving real business results for your brand.
